|
Travis County Butterfly Checklist
Return to Texas Entomology - Compiled by Mike Quinn
Butterfly Data From:
Durden, C.J. 1990. Guide to Butterflies of Austin. Texas Botanical Garden Society, Austin. 110 pp.

|
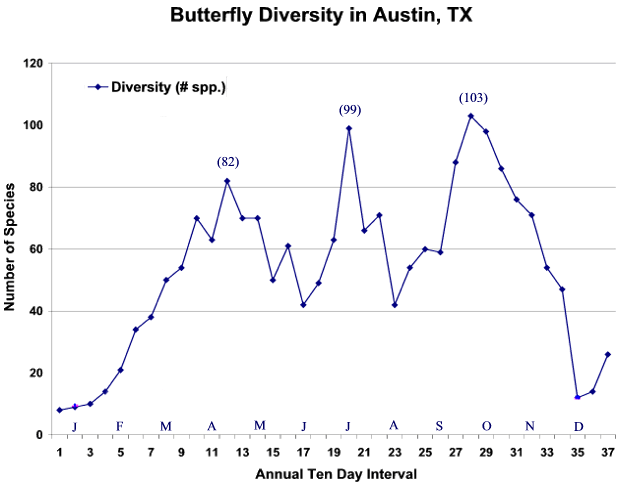
Y axis is total number of species seen within each 10 day period of the X axis, primarily between 1968 and 1990.
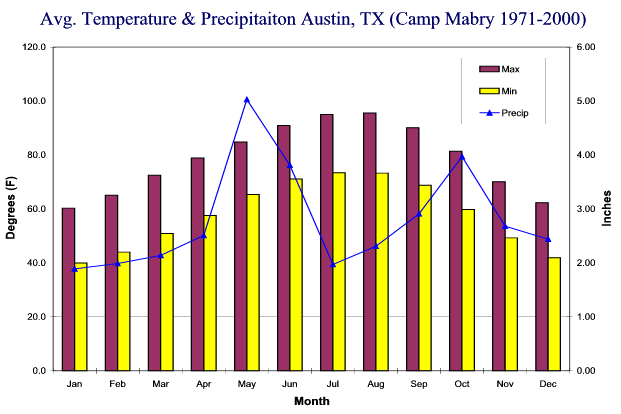
First and last peaks in butterfly diversity strongly correlate to peaks in precipitation.
Mid-Summer peak of 99 species (during period 20) due to annual butterfly count held at that time.
Chris Durden reports the number of species recorded on July butterfly counts has risen from 99 in 1989 to 124 by 2004.

|
The raw weather data from U.S. Climate Normals website via the Michael Hammer, Undergraduate Assistant, Office of the State
Climatologist, January 31, 2005 |
01 Jul 2007 © Mike Quinn / mike.quinn@tpwd.state.tx.us / Texas Entomology